


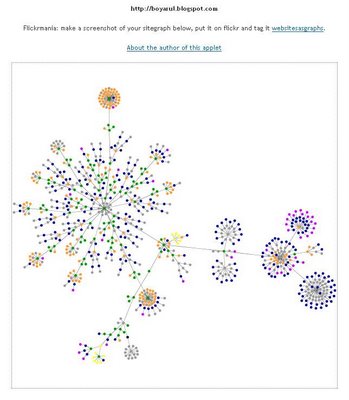
Am descoperit (via jobsessive) un blog cu un applet ce reuseste sa redea grafic structura unui site bazandu-se pe tag'urile HTML ale acestuia.
Graficul de mai jos a fost general pentru blogul de fata.
Vad ca am multe DIV'uri, IMG'uri si A'uri.
Than make a screenshot of your sitegraph, put it on flickr.com and tag it websitesasgraphs. Cool!
Later edit: Vad ca ideea de mai sus a fost dezvoltata de altcineva (Forrest)
Graficul de mai jos a fost general pentru blogul de fata.
Vad ca am multe DIV'uri, IMG'uri si A'uri.
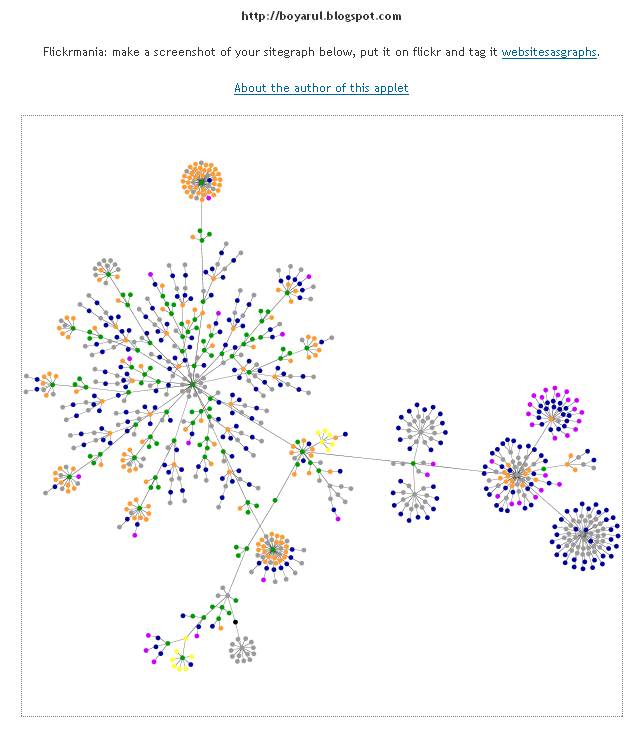
HTML consists of so-called tags, like the A tag for links, IMG tag for images and so on. Since tags are nested in other tags, they are arranged in a hierarchical manner, and that hierarchy can be represented as a graph.Now it's your turn to TEST your website / blog !
I've used some color to indicate the most used tags in the following way:
blue: for links (the A tag)
red: for tables (TABLE, TR and TD tags)
green: for the DIV tag
violet: for images (the IMG tag)
yellow: for forms (FORM, INPUT, TEXTAREA, SELECT and OPTION tags)
orange: for linebreaks and blockquotes (BR, P, and BLOCKQUOTE tags)
black: the HTML tag, the root node
gray: all other tags.
Than make a screenshot of your sitegraph, put it on flickr.com and tag it websitesasgraphs. Cool!
Later edit: Vad ca ideea de mai sus a fost dezvoltata de altcineva (Forrest)
I made some more updates to my modified version. You can click to drag and view node tags and pan and zoom.Mmm. That's better.


super interesanta idee ...
RăspundețiȘtergeresuper neinteresant ca nu imi merge (e bazat pe flash , eu n-am flash).